Managed Kubernetes
Latest
Frequently Asked Questions
Solutions
How Tos
Internal Only
Templates
Powered By
Title
Message
Create new category
What is the title of your new category?
Edit page index title
What is the title of the page index?
Edit category
What is the new title of your category?
Edit link
What is the new title and URL of your link?
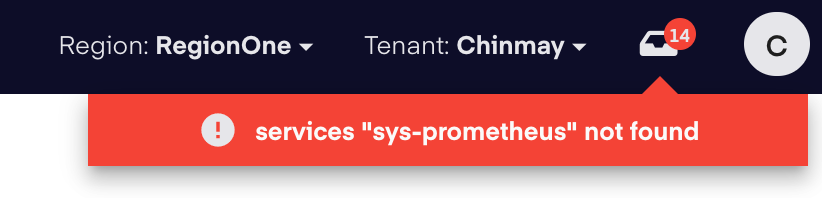
Monitoring tab Displays the Error "services sys-prometheus not found"
Copy Markdown
Open in ChatGPT
Open in Claude
Problem
When you access the Monitoring tab, the following error is observed in the UI.
Environment
- Platform9 Managed Kubernetes - All versions
- Prometheus
- Grafana
Cause
The above error is observed because the monitoring is not enabled on the cluster.
Resolution
- Please refer to the following documentation to enable monitoring for a cluster.
VariableType to search · ESC to discard
GlossaryType to search · ESC to discard
InsertType to search · ESC to discard
No matches
Last updated on
Was this page helpful?
Discard Changes
Do you want to discard your current changes and overwrite with the template?
Archive Synced Block
Message
Create new Template
What is this template's title?
Delete Template
Message